


We tend to think of the brightness or apparent magnitude of stars and their location in the sky to be the most important thing to know about them. But there is much more to them, and if you make yourself aware of their characteristics, it will certainly enhance your enjoyment of stargazing.
A star has a spectral type that can tell us a lot about it, such as its size, color and luminosity, any strange behavior, and its past and future. You can also make comparisons with the Sun and other stars. The type is based on the electromagnetic spectrum, which includes all visible wavelengths, radio waves, and X-rays and gamma rays. This provides two vital pieces of information: the star’s surface temperature and atmospheric pressure.
The temperature determines the color of the star, and how bright it is, i.e. the amount of light emitted from a square meter of its surface. The atmospheric pressure can tell us about the star’s gravity and consequently give us some idea of its size, anywhere from dwarf to giant. This isn’t always infallible – neutron stars are small, but incredibly dense with an extremely powerful gravity field.
Once you know the size and surface brightness of the star, you can then determine its luminosity, which is a measure of its total light input, and astronomers call this the star’s absolute magnitude. A star’s luminosity can be compared with other known magnitude stars to provide a fairly accurate estimate of the star’s distance. It also can tell you something about the age of the star, whether it is young, middle-aged, or close to death. We know that massive stars have intense but relatively short lives, sometimes exploding as supernovas, or, with the most massive, becoming eternal black holes. The spectral type may provide additional information on the star such as unusual chemical properties, a large atmosphere, any strange surface activity, rapid rotation, and other distinctive characteristics.
As you become a more experienced astronomer you will develop a better feel for the spectral types of stars. Experiments in the laboratory involving passing light through a thin slit and then a prism produce different spectral lines. When a solid, liquid or gas of high density is heated to produce a glow, it emits a continuous spectrum of light without any lines present, labeled a continuum. On the other hand a gas of low density will only glow in certain wavelengths (colors) of the visual spectrum, producing discrete, bright bands of emission lines. When a sample of the gas at a lower temperature is tested, dark absorption lines are observed at the specific wavelengths of the colored emission bands when the gas was hot. This lab work was a great breakthrough as astronomers can now compare the spectral lines with those obtained by observation to determine the nature of the stars in our sky.
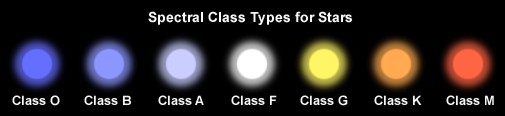
The original system of classifying stellar spectra, introduced at Harvard College Observatory in 1886, was to use capital letters, with A being the simplest spectrum, up to Q being the most complex. But later a more fluid system was adopted with hot blue-white stars at one end and cooler orange-red stars at the other. But the old lettering remained and the order from blue to red was O, B, A, F, G, K and M. L and T have now been added. To add finer distinctions, numbers from 0 to 9 were added, so that every star is assigned a letter and a number, e.g. G5.
The classification system is not foolproof. Some hot blue stars exhibit strong emission lines. Some stars in the same spectral type have different absorption lines; some be narrow and sharp, others broader, mainly as a result of varying atmospheric pressure, which can alter the intensity ratios of certain spectral lines.
Stars are further classified according to their size by their luminosity, I for super-giants (with subdivisions for decreasing luminosity, Ia-0, Ia, Iab and so on), II for bright giants, III for normal giants, IV for sub-giants, V for normal dwarfs, and VI for sub-dwarfs.
The spectral type of the Sun is G2V. Using this information, temperature and luminosity can be plotted on a graph, which produces a diagram called Hertzsprung-Russell (H-R diagram). Most stars are found near the main sequence for the stable majority of their lives, which is millions of years for hot, massive stars and billions for smaller, cooler stars like the Sun. The smaller stars will first expand to become red giants, (some super-giants) then become white dwarfs, and the massive ones will explode as supernovae. Super-massive stars will collapse in on themselves and become black holes.